ශ්රී ලංකා කොන්සල් ජෙනරාල් කාර්යාලය, කරච්චි,පාකිස්ථානය
இலங்கை கொன்சல் ஜெனரல் அலுவலகம், கராச்சி, பாகிஸ்தான்
Consulate General of Sri Lanka in Karachi, Pakistan

Sri Lanka’s Trade Relations with Pakistan
Trade and economic relations between Pakistan and Sri Lanka are solid and longstanding. Pakistan is the second largest trading partner of Sri Lanka in the SAARC region. Sri Lanka was the first country to sign a Free Trade Agreement with Pakistan. A substantial growth is seen in bilateral trade, particularly after implementation of the Pakistan–Sri Lanka Free Trade Agreement (PSFTA) in 2005.
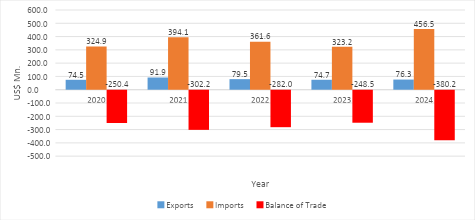
- Sri Lanka’s Exports, Imports, Total Trade & Balance of Trade with Pakistan
Sri Lanka’s total exports to Pakistan have fluctuated over the past five years, peaking at US$ 91.9 million in 2021. Imports from Pakistan have also shown variability, with the trade balance consistently remaining in Pakistan’s favor during this period.
Sri Lanka - Pakistan Trade Relations
| Description | 2020 | 2021 | 2022 | 2023 | 2024 |
|---|---|---|---|---|---|
| Exports | 74,522,156 | 91,883,759 | 79,509,680 | 74,690,891 | 76,307,524 |
| Imports | 324,913,545 | 394,110,842 | 361,553,951 | 323,154,547 | 456,511,962 |
| Balance of Trade | -250,391,389 | -302,227,083 | -282,044,271 | -248,463,656 | -380,204,438 |
| Total Trade | 399,435,701 | 485,994,601 | 441,063,631 | 397,845,438 | 532,819,486 |
- Sri Lanka’s Exports to Pakistan
Pakistan was the 31st largest export market for Sri Lanka with a share of 0.6% in 2024. In 1977, Pakistan was Sri Lanka’s largest export market with a share of 8.67%. Sri Lanka’s major export items to Pakistan for the period 2020 to 2025 (up to February) are provided in the annexure.
- Sri Lanka’s Imports from Pakistan
Pakistan was the 10th largest Import partner of Sri Lanka with a share of 2.4% in 2024. Sri Lanka’s major import items from Pakistan for the period 2020 to 2025 (up to February) are provided in the annexure.
- Preferential Trade
The Pakistan–Sri Lanka Free Trade Agreement (PSFTA) was signed on 1st August 2002 and came into force on 12th June 2005, making it Sri Lanka’s second bilateral Free Trade Agreement. The PSFTA has made a moderate contribution to enhancing bilateral trade between the two countries.
In addition to the PSFTA, both Sri Lanka and Pakistan are also members of the South Asian Free Trade Area (SAFTA) and the SAARC Preferential Trading Arrangement (SAPTA).
- Scope for further expansion of Sri Lanka’s Exports to Pakistan
Considering the growing demand in Pakistan and Sri Lanka’s supply capabilities, the following products have strong potential for further expansion in the Pakistani market.
- Black tea
- Vegetable products
- Cinnamon, not crushed nor ground
- Desiccated coconuts
- Pepper, not crushed nor ground
- Nuts
- Solid/Cushion rubber tires
- Brassieres
- Mechanically made lace
- Animal feed
- Cloves
- Copra
- Artificial staples
- Fresh coconuts
- Surgical gloves of vulcanized rubber
- Boards for electric control
- Gloves with plastics/rubber, knitted or crocheted
- Food preparations
- Coconut fiber
- Coconut oil
Further, Pakistan’s industries—particularly in steel, pharmaceuticals, plastics, sugar, and poultry—possess significant expertise and production capacity. These sectors present valuable opportunities for collaboration with Sri Lankan industries. By partnering with their Sri Lankan counterparts, Pakistani manufacturers can benefit from knowledge and technology exchange while also leveraging Sri Lanka’s market access preferences to expand exports to other regions, including South Asia, Southeast Asia, and the European Union.
Such collaboration would enable Pakistani businesses to tap into preferential trade arrangements available to Sri Lanka and enter new markets more effectively. Sri Lankan industrialists are encouraged to explore these synergies and pursue strategic partnerships with Pakistani industries for mutual growth.
- Pakistan - Sri Lanka Free Trade Agreement (PSFTA)
- Following the implementation of the PSFTA, a diverse range of Sri Lankan products entered the Pakistani market, including fresh pineapple, MDF boards, sports goods, tamarind, edible oil, porcelain and ceramic ware, furniture, electrical items, herbal cosmetics, plastic and leather goods, seafood, various rubber forms, surgical gloves, copra, cut flowers, gems & jewelry, and aquarium fish.
- Despite moderate use, PSFTA holds significant untapped potential compared to other FTAs Sri Lanka is party to, due to various restrictive and practical limitations.
- Potato quota (1,000 MT annually) granted to Pakistan under PSFTA has seen zero utilization.
- Pakistan provides an annual apparel quota of 3 million pieces, yet utilization remains low due to limited exporter interest from Sri Lanka.
- A TRQ of 10,000 MT for tea was granted to Sri Lanka, but utilization remains minimal. The challenge lies in meeting Rules of Origin (ROO). To address this, a draft Product Specific Rule (PSR), jointly developed by the Department of Commerce and Sri Lanka Tea Board, has been submitted to Pakistan for consideration.
- For Basmati rice, Pakistan offers a 6,000 MT annual quota, allocated by the Department (with Ministry oversight) to state and private entities. A rising interest among private importers has been observed in 2023 and 2024, indicating growing engagement with the PSFTA provisions.
Annex ‘A’ - No-Concession List (Negative List) of Pakistan
Annex ‘B’ - No-Concession List (Negative List) of Sri Lanka
Annex ‘C’
Annex C deals with the rules of origin, which have to be complied with by the exporters of the two countries in order to qualify their products for preferential duty benefits. Based on the origin, the Rules of Origin categorize the products exported under the PSFTA into the following two main segments.
Products wholly produced or obtained in the territory of the exporting country such as agricultural, fishery and mineral products.
Products, not wholly produced or obtained in the territory of the exporting country (manufactured products).
All manufactured products falling under the category (b) above should contain a minimum of 35% of Domestic Value Addition of their FOB value in order to qualify for preferential treatments. Further, it is also necessary that all non-originating materials, used by the exporters change their HS codes at six-digit level against that of the final product as a result of the manufacturing process undertaken in the exporting country.
Cumulative Rules of Origin:
The Cumulative Rules of Origin encourages exporters to source their inputs from the other contracting country. However, the Domestic Value Addition in the territory of the exporting country shall not be less than 25% of the FOB value of the final product, while the aggregate value addition in both contracting parties should be minimum of 35% of the FOB value. In addition, the respective products should also conform to the Change of HS code requirement (at six digit level) as in the case of the manufactured goods, referred to under category (b) above.
Provision for Change of HS Codes at six-digit level, has made the Rules of Origin of the PSFTA more flexible, compared to most of the other Free Trade Agreements, which stipulate that Change of HS Code should take place at four digit level.
Annex I - Sri Lanka’s Major Export Items to Pakistan (2020 –2025 (up to February) -Values in US$ Mn.
| Code | Description | 2020 | 2021 | 2022 | 2023 | 2024 | 2025 (Jan - Feb) |
|---|---|---|---|---|---|---|---|
| S.1002 | Textile | 13,205,865 | 14,150,151 | 6,883,557 | 10,733,029 | 14,124,129 | 2,290,829 |
| S.0701 | Betel Leaves | 15,447,306 | 15,118,934 | 14,854,534 | 14,351,424 | 9,254,194 | 479,314 |
| S.0301 | Coconut Kernel Products | 8,180,861 | 8,885,337 | 10,246,405 | 8,281,700 | 8,760,443 | 656,231 |
| S.1899 | Other Products of Base Metal | 1,055,138 | 1,145,634 | 197,184 | 232,543 | 7,623,274 | 1,286,588 |
| S.1901 | Electrical & Electronic Products | 2,703,469 | 6,425,653 | 8,604,645 | 8,260,040 | 7,293,902 | 787,410 |
| S.1702 | Articles of Stones | 1,121,240 | 5,726,350 | 5,597,892 | 3,754,759 | 5,133,058 | 1,152,542 |
| S.0201 | Natural Rubber | 9,812,836 | 8,757,958 | 9,452,775 | 7,129,698 | 4,863,031 | 1,467,758 |
| S.0303 | Coconut Shell Products | 1,824,340 | 3,425,269 | 5,396,153 | 5,029,657 | 4,167,647 | 887,219 |
| S.1601 | Chemical Products | 3,153,521 | 6,732,520 | 3,081,033 | 2,997,883 | 3,159,440 | 466,598 |
| S.0203 | Rubber Finished Products | 3,707,187 | 4,375,680 | 3,195,316 | 2,064,731 | 1,657,004 | 141,580 |
| S.0404 | Nutmeg & Mace | 364,321 | 309,617 | 489,888 | 753,397 | 1,471,426 | 187,101 |
| S.1602 | Plastic Products | 528,395 | 1,096,796 | 657,329 | 791,469 | 1,129,879 | 165,483 |
| S.0302 | Coconut Fiber Products | 1,320,199 | 1,669,538 | 1,410,735 | 892,294 | 997,753 | 142,914 |
| S.0104 | Instant Tea | 249,378 | 407,165 | 748,882 | 593,116 | 903,283 | - |
| S.2101 | Petroleum Oils | 980,630 | 4,524,675 | 2,429,677 | 3,333,851 | 757,343 | 576,640 |
| S.1803 | Nails, Screws, Bolts & Nuts of Metal | 20,832 | 278,775 | 1,113,812 | 1,349,158 | 656,187 | 53,272 |
| S.1104 | Rice, Cereals, Oil Seed and its Products | 435,601 | 518,446 | 423,454 | 387,001 | 634,239 | 106,845 |
| S.1107 | Animal Feed | 941,471 | 732,614 | 288,047 | 590,872 | 546,103 | 60,628 |
| S.1502 | Stationery | 459,819 | 349,889 | 456,867 | 537,985 | 538,509 | 116,488 |
| S.1704 | Other Mineral Products | 217,430 | 415,212 | 363,204 | 139,816 | 342,915 | 69,337 |
| S.1503 | Other Paper & Paper Products | 647,850 | 287,856 | 154,643 | 187,717 | 304,674 | 71,460 |
| S.2299 | Other Manufactures nes | 40,915 | 171,460 | 179,726 | 233,635 | 276,552 | 86,517 |
| S.1405 | MDF & Fibre Boards | 3,456,124 | 2,507,384 | 623,270 | 396,707 | 248,813 | - |
| S.1001 | Apparel | 874,887 | 728,350 | 1,029,675 | 303,293 | 230,576 | 6,230 |
| S.1103 | Processed Food | 76,875 | 8,478 | 285,107 | 195,688 | 146,845 | 5,427 |
| S.2201 | Toys, Games & Sport Requisites | 28,083 | 88,100 | 134,727 | 134,384 | 139,196 | 20,342 |
| S.1902 | Transport Equipment & Parts | 18,906 | 196,239 | 5,802 | 26,927 | 127,597 | - |
| S.0703 | Plants and Parts of Plants | 64,720 | 112,685 | 177,021 | 179,476 | 111,779 | 22,732 |
| S.0101 | Tea Packets | 57,006 | 99,406 | 125,782 | 70,843 | 108,096 | - |
| Sub total | 70,995,205 | 89,246,171 | 78,607,142 | 73,933,093 | 75,707,887 | 11,307,485 | |
| Total | 3,526,951 | 2,637,588 | 902,538 | 757,798 | 599,63 | 59,587 | |
| Other | 74,522,156 | 91,883,759 | 79,509,680 | 74,690,89 | 76,307,524 | 11,367,072 |
Annex II - Sri Lanka’s Major Import Items from Pakistan (2020 –2025 (up to February) -Values in US$ Mn.
| Code | Description | 2020 | 2021 | 2022 | 2023 | 2024 | 2025 (Jan - Feb) |
|---|---|---|---|---|---|---|---|
| S.1002 | Textile | 98,095,001 | 144,538,862 | 157,745,981 | 121,054,491 | 138,208,119 | 20,636,578 |
| S.0503 | Vegetables | 50,207,977 | 53,809,688 | 41,519,341 | 41,849,582 | 93,719,339 | 11,529,459 |
| S.1704 | Other Mineral Products | 100,220,132 | 108,558,866 | 62,262,487 | 46,534,837 | 71,510,227 | 10,970,998 |
| S.1104 | Rice, Cereals, Oil Seed and its Products | 8,565,925 | 9,789,150 | 21,332,045 | 45,388,229 | 58,599,006 | 3,816,873 |
| S.1601 | Chemical Products | 30,945,314 | 37,584,549 | 36,844,306 | 40,029,154 | 45,512,567 | 6,145,038 |
| S.1001 | Apparel | 6,165,624 | 7,126,677 | 8,455,952 | 6,787,194 | 10,808,973 | 3,109,883 |
| S.1102 | Sugars, Sugar Confectionery & Bakery Products | 154,251 | 301,458 | 195,014 | 3,050,861 | 7,432,648 | 7,133,861 |
| S.1602 | Plastic Products | 7,798,184 | 10,826,182 | 9,126,396 | 3,842,253 | 6,367,847 | 864,409 |
| S.1899 | Other Products of Base Metal | 8,418,460 | 7,112,091 | 3,228,083 | 3,684,182 | 5,843,227 | 807,308 |
| S.0501 | Fruits | 2,311,738 | 3,899,721 | 2,636,842 | 2,249,574 | 5,520,513 | 3,480,173 |
| S.1103 | Processed Food | 761,525 | 1,174,112 | 910,418 | 1,778,245 | 3,198,666 | 610,218 |
| S.1503 | Other Paper & Paper Products | 1,607,259 | 742,358 | 1,794,073 | 619,104 | 1,395,942 | 178,293 |
| S.1901 | Electrical & Electronic Products | 669,025 | 1,213,432 | 756,477 | 406,398 | 1,282,283 | 188,506 |
| S.1107 | Animal Feed | 658,488 | 656,508 | 9,157,196 | 865,175 | 1,271,401 | 345,641 |
| S.0801 | Edible Fish Products | 2,643,554 | 378,260 | 123,215 | 322,830 | 1,126,232 | 337,712 |
| S.1301 | Raw Hides & Skins | 1,704,405 | 1,431,309 | 2,337,013 | 1,056,254 | 777,548 | 330,752 |
| S.2299 | Other Manufactures nes | 187,875 | 193,087 | 182,315 | 343,623 | 562,371 | 66,922 |
| S.1101 | Processed Vegetables, Fruits & Juices | 224,748 | 413,490 | 309,599 | 303,539 | 542,281 | 3 |
| S.0703 | Plants and Parts of Plants | 590,704 | 790,294 | 334,741 | 446,345 | 531,667 | 57,405 |
| S.0412 | Condiments | 946,534 | 747,792 | 341,058 | 394,560 | 530,172 | 73,551 |
| S.2201 | Toys, Games & Sport Requisites | 162,185 | 332,759 | 167,591 | 534,786 | 450,769 | 140,660 |
| S.1304 | Gloves, Mitts & Mittens of Leather | 5,451 | 8,102 | 14,306 | 117,020 | 408,643 | 139,473 |
| S.0499 | Other Spices and Spice Mixtures | 507,585 | 1,018,655 | 150,742 | 952,750 | 277,103 | - |
| S.1805 | Tools, Implements, Cutlery & Parts | 232,260 | 262,089 | 246,958 | 143,825 | 135,298 | 2,534 |
| S.2204 | Buttons, Studs, Fasteners & Similar Products | 64,490 | 205,013 | 410,475 | 27,874 | 118,588 | 8,216 |
| Sub total | 323,848,694 | 393,114,504 | 360,582,624 | 322,782,685 | 456,131,430 | 70,974,466 | |
| Balance | 1,064,851 | 996,338 | 971,327 | 371,862 | 380,532 | 61,207 | |
| Total | 324,913,545 | 394,110,842 | 361,553,951 | 323,154,547 | 456,511,962 | 71,035,673 |